
A Look at Jefferson’s Black Residents by Josh Beckworth and the Appalachian Studies Students of Ashe County High School
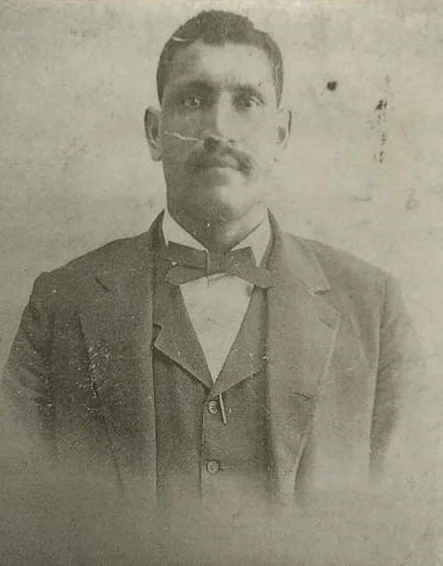
Seen here is an image of Adam Roberts. Roberts was a Black Union Army veteran who had been raised in Jefferson by his adopted mother, Mary Milam. After the Civil War, Roberts returned to Jefferson and became one of the town’s most successful entrepreneurs. He operated a blacksmith shop at the corner of Long and Academy streets, as well as a water-powered grist mill along Naked Creek. His home, which he shared with his wife Winnie, still stands in Jefferson today.
The decades following the Civil War represent a critical transition period for newly freed Black Americans. Even though Ashe County’s black population was smaller than in other areas of the South, these decades of reconstruction were equally important for forming new social orders. With the help of Appalachian Studies students at Ashe County High School, the Historical Society recently undertook the task of identifying every black resident recorded in the town of Jefferson in the 1870 and 1880 censuses. Information about households, ages, genders, neighboring families, and occupations were recorded in a spreadsheet. Artificial Intelligence was then used to analyze this data. The following report reflects these findings.
Household Composition
The census data reveals diverse family arrangements as freed people established independent households:
In 1870, the average Black household contained 3.27 people, slightly decreasing to 2.93 people by 1880
Large multigenerational households were common in both decades, with the largest containing 9-11 members
Single-person households represented a significant portion of the community—39% in 1870, increasing to 45.6% by 1880
These patterns suggest that while extended family networks remained important, the labor market of the era still relied on individuals living with or near employers. Many of these single-person household were quite migratory and would leave Jefferson between census collection years.
Female-Headed Households
One notable finding is the presence of female-headed households in 1870, representing 7.3% of all Black households. The most prominent example was the household of "America Adeath" who headed a home with eight members, including several children with different surnames, suggesting a blended family or the taking in of orphaned or displaced children.
Intriguingly, the analysis found no clearly identifiable female-headed households in the 1880 census, suggesting possible changes in family composition or recording practices.
Geographic Integration and Segregation
The neighbor data recorded in the census provides fascinating insights into residential patterns of the newly free Black population:
In 1870, 31.1% of Black residents lived near only white neighbors, 0.7% lived near only other Black neighbors, and 7.4% lived in mixed neighborhoods
By 1880, 37.5% lived near only white neighbors, 6.0% lived near only other Black neighbors, and just 0.6% lived in mixed neighborhoods
This shift toward more distinct residential segregation over time reflects a tendency for black residents of Jefferson to move, either voluntarily or through social pressure, into more racially segregated areas. The establishment of the largely black community at Bristol, just outside of Jefferson’s town limits, occurred as a result of this segregating movement in the 1880s.
Looking at specific examples: Mary Goodman lived next to both white (Joseph Garvey) and Black (Joseph Bower) neighbors in 1870, exemplifying the more integrated living arrangements of the earlier period.
Common Occupations
The occupational data illustrates the economic reality facing freed people in the Jefferson economy:
In 1870, the most common occupations among Jefferson's Black residents were:
Agricultural labor ("works on farm") - 21 individuals
Domestic work ("keeping house," "house keeping") - 12 individuals
General service ("servant") - 2 individuals
This pattern persists into 1880, although a greater distinction was drawn between the specific types of labor:
Domestic service ("servant") - 16 individuals
Keeping house - 8 individuals
Farming - 5 individuals
Farm labor - 7 individuals
Boarders - 5 individuals
The emergence of more Black farmers by 1880 suggests some economic advancement, though most remained in positions similar to their pre-emancipation work. The appearance of "boarders" in the 1880 census reinforces the notion that many of these jobs were unstable and were being pursued by people who hoped to earn more money in the town economy, but who had less long term intention of settling in the community.
One of the most striking patterns revealed in our analysis is the high degree of population flux between 1870 and 1880:
Only 10 family surnames appear in both the 1870 and 1880 censuses
20 families present in 1870 had disappeared by 1880
25 new family names appeared in the 1880 census
By 1880, other areas of the county were forming their own segregated communities, which attracted migration from the town of Jefferson. Many left the county altogether; however,within county the communities of Peak Creek (four confirmed relocations) Old Fields (3 confirmed relocations) and Pine Swamp (3 confirmed relocations) seem to have attracted the majority of the migration. This high turnover rate suggests that Jefferson served as a transitional community for many freed people who were actively seeking better opportunities elsewhere. A small minority of the 1870 Black residents explicitly remained in Jefferson by 1880, with others moving to nearby communities, other counties, or different states altogether.
The age structure of Jefferson's Black community reveals a predominantly young population:
In 1870: 45.9% were children (0-14), 26.3% young adults (15-24), 15.8% adults (25-44), 9.0% middle-aged (45-64), and only 3.0% elderly (65+)
In 1880: 49.1% were children (0-14), 19.4% young adults (15-24), 21.2% adults (25-44), 8.5% middle-aged (45-64), and 1.8% elderly (65+)
This youthful demographic profile suggests high fertility rates and reflects the population growth happening within the community. The low percentage of elderly individuals may indicate the harsh toll that slavery took on longevity or could suggest that older freed people may have moved to reunite with family members separated during slavery.
The census data from 1870 and 1880 provides a remarkable window into the lives of Jefferson's Black residents during a time of unprecedented change. These records reveal a dynamic community in transition—establishing independent households, navigating shifting residential boundaries, seeking economic opportunities, and exercising their newfound freedom of movement.